How Social Media Is Influencing Institutional Investor Investment Decisions

If your mutual fund or exchange-traded fund (ETF) firm markets to institutional investors, you’ll want to check out social media survey results that “astounded” the research firm and “awed” an asset management marketer. Social media, the data suggests, is making a difference not only in how institutional investors source information but in the subsequent action they take, too.

In November and December 2014, Greenwich Associates, working with LinkedIn, fielded an online survey of 256 global institutional investors including 100 in North America, 105 in Europe and 51 in the Asia Pacific. The survey targeted decision-makers and influencers of investment decisions at their institution (top three titles: chief investment officer, portfolio manager, investment analyst) who used digital platforms at least once in the past year to learn about financial topics related to their investing role.

The global cut of the results was the focus of a LinkedIn Marketing Solutions Webcast last week, whose replay you can listen to below. In addition to Greenwich and LinkedIn presenters, Legg Mason’s Director and Head of Global Web Services Kerry Ryan presented best practices and results to date of some LinkedIn success using sponsored update campaigns to target institutional investors.

A report on the Europe-only survey data is due this week, with a report on the North America results scheduled to be released next month. Expect there to be some differences from the global cut, according to the presenters.  

LinkedIn, Facebook And Twitter

Most surprising to Greenwich’s Managing Director Dan Connell and Ryan was that one-third of investors surveyed said they’d taken information learned via social media to start a discussion with or choose to work with a particular asset management firm. This is the first work to document this, I'm fairly certain, and the research may open many eyes.

As he reviewed the results, Connell seemed delighted to report that LinkedIn scored as the preferred social media source, with 48% of all institutional investors using the platform. The first slide showing the usage of the social networks even grays out all but LinkedIn.

In my opinion, such parochialismand as interesting as it was, the inclusion of a happy LinkedIn advertiser as part of the program—devalues the independence of the research. The work also includes useful insights on investors’ reliance on Facebook, Twitter and YouTube, and can serve a higher purpose than just to support interest in LinkedIn. The following is a screenshot of one of the slides, with annotations added by me.

One surprise not discussed, for example: Almost half of institutional investors (47%) say they use Facebook to learn about investment products/services. This is slightly higher than those who use LinkedIn for that purpose (45%). The finding is at odds, by the way, with what ShareThis reported about the finance content that gets shared on Facebook. 

Notwithstanding the cheerleading for LinkedIn, the full 56-minute presentation is worth your attention. Here are just a few highlights to pique your interest and prompt you to hit the play button. 

  • Nearly all (97%) institutional investors use digital media sources for professional purposes and 79% use social media at work. That's a dramatic change in the last five years, Connell noted.
  • Institutional investors are turning to social media for insights, opinions and content relevant to their investing roles. And, those insights are influencing decision-making.
  • The survey provides four answers related to investors’ interest in asset management firm content and executives specifically, and other answers related to investment product and services are relevant, too. Are you working with executives who are dragging their heels about whether they need to have a social media (probably LinkedIn) presence? Data in this table, which I created to highlight the asset management questions, might be helpful.


  • Legg Mason’s 22 sponsored updates have produced an overall 0.48% clickthrough rate and 0.54% engagement rate. Since the start of the year, the company page has attracted 346 new followers. 

An Armchair View Of The Digital Decisions Underlying The Schwab/Wealthfront Dust-up

Pull up a seat to one of the more captivating online brand-to-brand exchanges we’ve been in a position to witness in the investment industry. Although the interaction happening this week between Charles Schwab and Wealthfront is fascinating on many levels, I’ll limit this post to just observations on the decisions underlying the digital communications. RIABiz, InvestmentNews and plenty of others will keep you up to date on the substance.

This evolving communications case study has to do with the emergence of robo-advisor services and controversy surrounding their claims. But, there’s potential for plenty of other contentious discussion this year (can you say smart beta?) that hits even closer to home for mutual fund and exchange-traded fund (ETF) firms.

So much of investment communications is planned, scripted and timed, leading marketers to believe that they have things under control. My question for you, prompted by the interactions discussed below: To what extent do your communications plans anticipate not just what you have to say but how others might respond?

Early on, firms may have been apprehensive about chaotic social platforms filled with trolls waiting to take money managers on. Thankfully, that hasn’t materialized.

Instead, what we are increasingly seeing are informed commentators, including product and distribution competitors as well as financial advisors themselves, publishing thoughtful counterpoints and challenges on their own blogs and content platforms.

Asset managers know they need to respond to the random tweet. That's so 2012.

But a precious few are 1)demonstrating that they’re paying attention to what’s being blogged about 2)posting a response, whether on their own blogs or in a comment to the original posts. Blog posts can be forever. Whatever stance your firm takes—to acknowledge, respond, ignore or be ignorant of them—will have consequences. 

The saga playing out this week may help frame your firm’s preparedness, including where, when, how and to whom to respond. 

What Happened

By way of background: On Monday morning, Schwab announced “a fully automated investment advisory service,Schwab Intelligent Portfolios, the only investment advisory service using sophisticated computer algorithms to build, monitor, and rebalance diversified portfolios based on an investor’s stated goals, time horizon and risk tolerance—without charging any advisory fees, commissions or account services fees.”

In response, on the same day, the CEO of Wealthfront, one of the startups expected to be most impacted by this service, wrote a scathing blog post. Adam Nash accused Schwab of falsely stating that its service was free because the firm will extract net revenue earnings from interest on the cash allocation of the recommended portfolios. Nash went on to say that “hidden fees" are contrary to the history of Schwab, concluding that the firm has “broken values.”

“Charles Schwab has become Merrill Lynch,” writes Nash, not intending it as a compliment.Less than 24 hours later, Schwab published what RIABiz described as a “rapid-response-counter-punch” reply to Wealthfront’s response. The piece called out Nash's "very loose interpretation of facts" and presented a three-point clarification. 

What follows is what this geek noticed and wondered about as all this interaction was taking place online.

The Wealthfront Post

Ladies and gentlemen, what we have here is a classic case of “newsjacking” on Wealthfront’s part. (See the David Meerman Scott site for more.)

This is not to take away from the import of its message. It’s to acknowledge that Nash’s fast-acting response assured that his perspective would be part of the conversation at the precise moment when Schwab would be getting attention. Nash successfully grabbed some of that attention for his view and business. 

What helped this succeed: A strong value proposition (there’s no time to crystallize your story when news is breaking), compelling visual assets (including two borrowed from Schwab—ouch!) and Twitter followers/supporters. This program has been in the works for a while, and Nash was prepared for the announcement. 

Most of the readers of this blog will be in Schwab’s position. Although once a challenger itself, Schwab today has almost $2.5 trillion in assets. Count on the fact that this launch (big and good news from the company’s perspective) was carefully orchestrated, including a national online, print and television advertising campaign, media outreach and finely crafted talking points. Yet within hours, a single blog post from the CEO of a firm that manages $2 billion (gained in three years) became part of the story and threatened to disrupt the best laid plans.

Did offense need to switch to defense? One can only imagine the drill that took place within Schwab’s communications team. For starters, how did they hear about the post—via their social media monitoring or did they get a heads-up? At the center of the discussions must have been this: “Do we dignify the post with a response?” The implication being that acknowledging the post could call more attention to it.

In fact, here are a few of the choice headlines that resulted:

Where The Responses Took Place

The first mention I saw of Adam Nash’s blog post was in a Schwab tweet. To read the post, I naturally headed to the Wealthfront blog—where there was no sign of what Wealthfront’s CEO said. That’s because the post was published under Nash’s byline on Medium.com.

Interesting. I assumed that a calculation was made to go where there was a larger absolute audience, probably to position the topic at a higher level than one company CEO griping about another company’s strategy. In fact, RIABiz reported that Nash’s “blog offensive is being waged on a personal level, which is why it appeared on his own blog..." Nash's blog, yes, but on another company's domain. 

Understood, and maybe there were compliance issues to consider, too. But there will be those who will come to Wealthfront’s site, looking for the post, and they will be lost. Conversely, those who go to the Medium post won’t see anything else about Wealthfront’s services. 

And, to make the point that any digital marketer would, the decision to use Medium results in a surrender of Wealthfront.com attention, site traffic and analytics. Links, especially from authoritative sites, still have value. And yet all the linking to Nash’s post on Medium will help lift Wealthfront’s search visibility not at all. Medium does make some viewer stats available but they’re not as robust as what Wealthfront would get from its own Google Analytics.

A Google search Wednesday for “Adam Nash Schwab blog post” required the searcher to hop over the Schwab response to Nash’s post (which doesn’t contain a link to it).

AdamNashPostSearchResults.png

Compare the page titles and URLs used for the posts for a partial explanation of Schwab’s higher ranking—that and the fact that Google results favor better-trafficked Websites.

URLs.png

Schwab is unusual in that it already maintains a section of its Website for Company Statements “in response to timely news and topics of interest. Statements are generally removed from this site after one year.” This is where it chose to publish its all-text response to Nash.

A few tweets have made some generational references to the old school way in which Schwab responded—via “a press statement” that used double spaces between sentences (really!). While much of the response is straightforward, it lets itself condescend in a few spots. I wonder how much thought was given to referring to Nash as “Adam” inasmuch as the response ostensibly came from the company and not an individual. 

There’s no provision for comments on the Company Statements pages, which is unfortunate given the statement's closing line: "We encourage transparency and dialogue and that is why we encourage investors to learn more at intelligent.schwab.com and review the facts."

Did Schwab consider commenting on the Medium post, as well, I wonder? As is, both firms have taken to their own corners to comment, leaving readers to their own devices in piecing the commentaries together. 

Getting The Word Out

Having published their respective messages, Nash and Schwab then took to Twitter (only) to make sure the word got out. The first tweet flew from Nash’s own account but soon the Wealthfront account also was pressed into action, to drive traffic to the Medium post as well as retweet supporting tweets of which there were many.  

You and I don’t know the total traffic to either post. From the sharing data counted by BuzzSumo, it looks as if the sharing done of Nash’s post through Wednesday far outpaced the sharing of the one-day older Schwab rebuttal. Note that the Nash post was shared on LinkedIn and Facebook, too. 

SharesOfThePosts.png

By Wednesday, Bitly reported about 2,900 clicks on bitly links to Nash’s post, and traffic to non-shortened links would be additional.

As of Wednesday, the @CharlesSchwab Twitter account (the @Schwab4RIAs account has not been involved) had not sent a mass distribution tweet with a link to its company statement. This seems to have been an effort to “contain” the discussion. 

schwab_intelligent_portfolios_graphic.jpg

However, Schwab reached out to Twitter accounts who tweeted about the Nash post. Specifically, through Wednesday it sent 15 individually addressed tweets (tweets that start with the @accountname, limiting the reach of the tweet to only mutual followers of both accounts). You can see the tweets under the Tweets & Replies Tab of the account.

It's possible that Schwab’s original communication plan included influencer marketing, which involves brands reaching out to identified influencers with the hope that the offer of early information or special access will yield positive coverage.

But these individually addressed tweets were not that. An account that tweeted about the Nash post is not likely to be open to any kind of perceived “manipulation” on Schwab’s part, not at that point. As stated, the purpose was to make sure that the account saw Schwab’s side of the debate.

Many of the accounts tweeted to in fact belong to those influential in the space, including Josh Brown, Michael Kitces and Paul Kedrosky. The net effect of that for those who follow these influencers is that multiple identical Schwab tweets showed up in the Twitter stream. A series of Schwab tweets is what first caught my attention.

Did the target account even click on the link? Better yet, did the target account retweet it, as many might feel obliged to do if they’d previously tweeted about Nash’s post? How many clicks did each attract?

Because Schwab provided each Twitter account with a unique shortened link (bitly), bystanders can see the effect of the outreach by account. Just by adding a plus sign to each bitly, we can get a look at where the outreach worked best. Through Wednesday, it looks as if there were nearly 1,500 total clicks to the page. Two bitlys were tweeted to The @ReformedBroker (Josh Brown), and together they drove almost 900 clicks or 60% of all. The most effective tweet is shown below.

By comparison, the bitly link to the press release announcing the Intelligent Portfolios attracted 118 clicks. Of course, there's no doubt Schwab is collecting more data on its outreach than we have access to. 

In Conclusion?

How to wrap this up? It can't be done, it's too soon. Can we agree to just adjourn?

Join me in watching how the substance of the debate unfolds and—particularly relevant for communicators—where and how it takes place. If nothing else, the jockeying by these two firms is demonstrating the importance of real-time listening, reacting and acting.

Maybe not on this scale or at this emotional pitch, but it’s reasonable to expect that your firm will be the subject of online discourse at some unknowable point. It’s an eventuality that cool heads, including those belonging to digital marketers, need to prepare for. 

Before You Go All-In On Facebook

“We’re starting to think more seriously about Facebook…”

I’ve heard this more than a few times from firms over the last six months. Typically, the firm has excelled with something else social (e.g., blog, Twitter account or LinkedIn company page) and believes it’s ready for something more challenging while potentially more rewarding.

The size of the social network itself (890 million daily active users in December 2014), its 2014 surge and the engagement potential all make Facebook impossible to ignore if you’re a marketer in 2015.


Mutual fund and exchange-traded fund (ETF) marketers absolutely should consider participation (beyond the base camps many have already set up) on Facebook for their own strategies. Not knowing what your business or marketing objectives are, not knowing what your client composition is, not knowing what your content and other resources are, etc., I can’t go much further than this.

…Except to encourage you to temper your enthusiasm by drilling into Facebook’s sensational traffic and engagement numbers. Financial services, let alone business-to-business organizations, cannot expect the same pick-up that other industries famously experience.

For some level-setting, let’s first take a broad look at social media and financial services. Afterward, we’ll zero in on Facebook.

10 Finserv Brands Dominate

There’s no shortage of ebooks and whitepapers about social media and financial services, but this Shareablee presentation delivered at a State of Financial Services Webinar in late November is distinguished by the data it presents. Unfortunately, the Webinar isn’t available on-demand.

Shareablee takes care to report financial services subsegments, noting that the lowest percentage (61%) of Investment Products & Services brands have social presences. Banking, insurance, loans and even payment services brands are more active. Data quoted is from January through October 2014. Note that LinkedIn isn't a platform included in this report. The annotations on the following slides are from me.

Within Shareablee's Investment Products & Services brands category are diversified firms and brokerages that are probably beyond your competitive set. They command the greatest share of voice.

Here’s the sobering slide: The top 10 brands dominate, representing 66% of all activity. If you’ve been successful, by your standards, with anything in social media, you are to be congratulated. It’s not easy to make an impact.


Next check out the Shareablee slide of Facebook sharing in particular. Despite all the hoopla about Facebook in 2014 and despite the pick-up of insurance and banking content, note the so-so sharing of investment product/service content.

This gets to the core content challenge of asset manager posts on Facebook. If you are not a Fidelity or Vanguard, if you don't sponsor community outreach programs (e.g., charitable benefits or sporting events), if you're new to engaging with a community and if the bulk of what you have to post is investment strategy and market insights, let’s be realistic about how much sharing your repurposed posts are going to get. How comfortable is a suit and tie at a barbecue?  

Minor digression: Before we leave the Shareablee deck, see the slide that shows the types of posts that people engage with. Across all financial services segments—but especially investment products and services—it’s photos! If you make just one tweak to your social strategy in all of 2015, please let it be to post more images.  

Does Facebook Drive Traffic?

Why take on another social network and especially Facebook? To drive both brand awareness and Website traffic. So, does Facebook drive traffic? All of the above was a prelude to encouraging Facebook-aspirants to watch the following Whiteboard Friday video, published on The Moz Blog last week. A transcript is also available on the page. 

It’s an engaging 17 minutes but if you’re short on time, here are a few highlights.

4:00: The Moz’s Rand Fishkin says the average page per visit of a Facebook visitor is about 1. “It tends to be the case that when you're in that Facebook feed, you're just trying to consume content, and you might see something, but you're unlikely to browse around the rest of the Website from which it came.” 

This compares to the average 3-5 pages consumed by people who arrive directly on your site and to Google search-sourced visits (2-2.5 pages on average). Obviously, you’ll want check your analytics to see how your various traffic sources perform.

6:48: But, Fishkin notes, “Facebook's likes and shares are very indicative of the kinds of content that tend to perform well in search. So, if we can nail that, if we understand what kinds of content get spread socially on the Web and engage people on the social Web, we tend to also perform well in the kind of content we create for search engines.”

7:38: Fishkin begins his top 10 tips for Facebook optimization. 

8:56: A social referral/introduction may lead to subsequent Website exploration. Here's a brief discussion of setting up analytics to track future visits from social referrals, and see this post for more.

12:43: Fishkin discusses limitations on the reach of brand content, a relatively recent adjustment Facebook made to dim the effect of what had been overwhelming brand content. The objective is to enable personal content, typically valued by users more, to resurface.

14:27: Facebook is difficult to "game" nowadays but it is still possible to “game human psychology,” says Fishkin. “If you can find the angles that people care about, that they're vocal about, that they get engaged, excited, angry, passionate, of any emotional variety about those things, that's how you tend to trigger a lot of activity on Facebook,” he says. Don't produce that kind of content yet? You'll need to.

If Facebook is a frontier you aim to settle in 2015, I'm rooting for you. Of course, an asset manager can succeed on Facebook. Just do your preparation, make sure you understand the level of new effort required, including some level of advertising spending, and be sure to track your results/effectiveness.

Maybe There's A Difference Between Male And Female Advisors

Asset management marketing is getting increasingly sophisticated. To support that statement, I’d point to mutual fund and exchange-traded fund (ETF) firms’ heightened capture and reliance on business intelligence and analytics, integrated communications across multiple channels, the increasing mastery of non-text forms of communicating.

Segmentation, for example, is an area where firms are making strides. The more customized, even personalized a communication, the greater its relevance.

But I’m wondering where investment management marketers are on what may be the most fundamental segment of all: gender. Does your customer relationship management system (CRM) capture the gender of your contacts? Can you/do you run reports segregating male financial advisors from females to isolate differences in response and even AUM and sales?  

My experience, and my impression corroborated with a few additional pings to others in the industry, is that the overall availability of information about the gender of database contacts is spotty.

Gender is a custom field in both Salesforce and SalesPage CRMs. But while it’s relatively trivial to add, it must be identified as a requirement—and at many firms that hasn’t happened. Capturing gender data isn’t a priority for Sales, which tends to drive CRM implementations.

Granted, most of the contacts in an asset manager’s CRM are going to be male. But, according to data kasina reported in 2013, female advisors made up 17% of advisors across all intermediary channels. That's plenty of female names as well as uncommon names or names that could go either way (e.g., Pat Allen) that justify a mandatory gender field.

Learning From Social Media Analytics

The insights being gleaned from social media use are what prompt the question now. Underlying virtually every social platform is a database that’s core to its value. The networks, and third parties with access to the APIs, produce demographic analyses that can be quite helpful to understand who an account is reaching and whether content adjustments are necessary, as is often the case.

To give you an idea, here’s a Demographics Pro analysis of the @RockTheBoatMKTG Twitter account.

The content I selected to tweet over the last six years is what attracted this group to the account. Seeing this was both eye-opening and sobering. These people look like they mean business. No, I won’t be bothering them with my real-time insights about The Bachelor.

At the same time, analysis of aggregated usage data is resulting in reports and commentary drawing gender distinctions between what works on social networks. To wit: 

  • “Pinterest’s Problem: Getting Men to Commit” was the headline of a Wall Street Journal article that offered “gender differences in information processing” as one reason for Pinterest’s unpopularity with men. Studies by Joan Meyers-Levy, a marketing professor at the University of Minnesota, “have shown that women are able to process information more comprehensively and do so at a lower threshold. Men are more selective and tend to focus on the essentials… 

In other words, Pinterest’s busy design may create an information overload for men. “If this was a magazine, they’d turn the page,” Ms. Meyers-Levy is quoted as saying. “It works for females because they like detail, they like more complexity.”

I read this article and then headed over to a busy, busy fund profile page. Hmmm. 

  • Several conclusions are being made based on differences in how social media is being used. 

Women are more vocal, expressive and willing to share, reports BrandWatch in this post aggregating gender data from multiple social media survey sources. More women use Facebook and Twitter. They’re interested in making connections and staying in touch. More women than men (58% vs. 42%) consume news in social media. The data show that women are more active altogether, more active on mobile devices and more likely to follow and interact with brands.

Men, who outnumber women on LinkedIn, use social media to gather the information they need to build influence—they perform research, gather relevant contacts and ultimately increase their status. 

  • Closer to home, Putnam’s December 2014 research on financial advisor use of social media was the first work (I believe) to report in-depth on advisor gender differences. The findings track other research, showing that women financial advisors do more but also benefit more when using social media for business. The screenshot at right is from Putnam’s infographic and shows that 71% of social media-using female advisor respondents gained clients versus 64% of male advisors. Their average asset gain of $5.6 million is more than three times the median of $1.7 million, slightly more than the average male gain of $5.5 million. 

Most interesting are the gender differences between the social media content that advisors react to. According to the Putnam data, female advisors are far more likely to respond to your blogs, podcasts and slideshows.

Pursuing More Hits Than Misses (Absolutely No Pun Intended)

An irony is that financial advisors themselves are increasingly focusing on gender differences between their male and female clients—with help from a few asset managers’ value-added programs.

Most mutual fund and ETF content teams today are somewhere in between producing just what’s required (the legacy of the good old days when the time and expense of print served as a natural limiter) and churning out as much as fast as they can. As the range broadens and volume rises to take advantage of burgeoning opportunities, the chances are that there will be more misses than hits.

A better command of the demographics of the names in your database could help steer some of this. Also: Tracking such data might help mitigate the risk and/or address challenges that arise when a disproportionate number of females are involved in the process of creating fund communications directed at salespeople and users that skew largely male.

Those of you with consistent, reliable data on the male/female composition of your database have an advantage. You’re able to study and understand any response differences that may exist. You can compare the demographic reach (including gender and other dimensions) of your owned communications with your social communications. You can test whatever content adjustments seem indicated. You could plan all-male or all-female communications, I suppose, but I’d tread carefully making any assumptions there.

Sales may have limited interest in documenting a contact’s gender in the CRM because they pride themselves on knowing the top 250 producers they’re focusing on—they don't have to check to see who's a woman and who's a man! If Marketing’s charge is to better understand and nurture the interest of everybody else, isn’t gender an obvious piece of data to begin to collect and understand?

Why Your Site May Be On The Verge Of Losing Lots Of Traffic

Here’s a quick test for you: Search for the ticker symbol of one of your firm’s funds, a big one, a small one, it doesn’t matter.

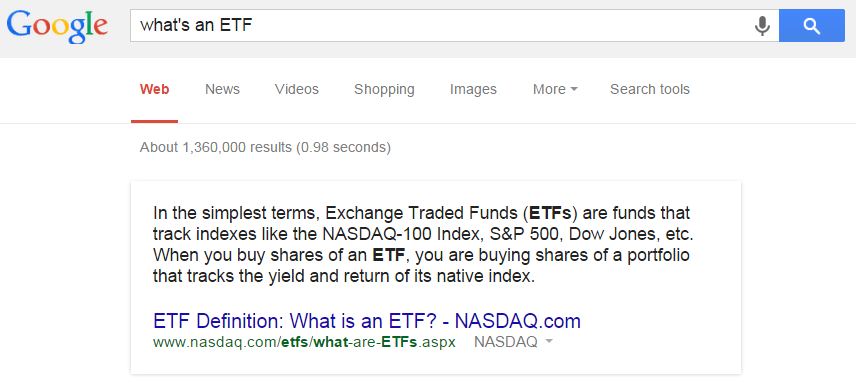
What’s the top search result? A big ole chart, right? The screenshot below shows the results of a Google search on a desktop and on a smartphone. (Incidentally, note how simple and clean the data display can be when not weighed down by the pesky disclosure that’s required on your site.)

How many searches do you suppose your site loses to Google Finance, Morningstar and Yahoo Finance, the sites linked to at the bottom of the ticker symbol graphs?

There’s no need to guess—just check your Webmaster Tools account (Search Traffic/Search Queries). You’ll likely see that your site is being displayed in search results for ticker symbol searches (Impressions) but that you’re not getting the majority of the clicks.

In all likelihood, the information that Google is providing to ticker symbol searchers right there on the search results page is either 1)satisfying the searcher or 2)driving the searchers to Google, Morningstar, Yahoo fund or (for ETF ticker searches) even MSN Money profile pages.

Ouch. This especially hurts because ticker symbol searchers are the most qualified site visitors you could ask for—no doubt you’d prefer them to come to your site, sign up for an email newsletter, ask for more information, check out other funds… Opportunity is being lost because Google (and Bing, too, by the way) siphons interest in the ticker symbols of your products and reroutes traffic.

Now, competition for organic search rankings is one thing. If the authority of your domain is lacking or if you haven’t taken the appropriate SEO steps to lift the visibility of your fund pages, well, then, you’ve had your fair chance and didn’t step up.

But this extraction of structured fund data from a third-party database is different because it’s completely beyond your ability to appeal.

The publishing of fund prices on the search results page has been going on for years. My sense is that asset management digital marketers are desensitized to the traffic/attention that’s being lost. Do you remember that parable about the frog in the water? As long as the water boils slowly, the frog won't jump out because he doesn’t perceive danger. 

The Knowledge Graph And Its Impact

As it turns out, asset managers have had an early taste of what many site publishers are now experiencing due to Google’s implementation of what it calls the Knowledge Graph.

The Knowledge Graph, according to Google’s 2012 introduction of it, enhances search by narrowing search results, summarizing relevant content around a search query, and facilitating deeper and broader searches. "It currently contains more than 500 million objects, as well as more than 3.5 billion facts about and relationships between these different objects. And it’s tuned based on what people search for, and what we find out on the Web," Google wrote three years ago.

Knowledge Graph-driven search results have become more prevalent in the last year. The goal of Knowledge Graph information, whether displayed in answer boxes immediately below the search box or in a panel to the right of the search results, is to instantly provide an answer that’s relevant to a search query. Relevant answers delivered on the spot are increasingly important as more searches take place on mobile devices. The fewer clicks required on a smartphone, the better.

This is an expanded role for Google. As opposed to just directing search traffic to the most relevant Websites, it’s now taking it upon itself to try to answer search queries. For a current overview of the various search-related initiatives underway at Google (i.e., Voice Search, Knowledge Graph, Google Now), see this Medium post, part one of a series. About 25% of search queries today produce Knowledge Graph answers, according to author Steven Levy.  

While fund sponsors never made a peep about Google effectively hijacking searches for ticker symbols, many Website publishers who explicitly monetize their sites are upset and confused about the rise of Knowledge Graph.

Some object to Google’s “scraping” their sites to extract a result to show in a Knowledge Graph answer box. It’s a backhanded compliment—Google thinks enough of the site to extract answers from it, but that results in a loss of visitors to revenue-producing pages.

It’s easy to see the value that’s being provided to the searcher. If all a searcher wants is a basic definition of ETF, this Knowledge Graph extract from Nasdaq.com might be enough. If the searcher wants to dig further, Nasdaq is in an advantaged position to get the click from the added prominence on the search results page.

Consequently, some search engine optimization experts are pivoting into Knowledge Graph Optimization. Sources of the Knowledge Graph include Google+, Wikipedia, Freebase and Schema, which is structured markup added to Websites to clearly identify standard elements that Google may want to lift. Following the markup standard for Customer Service phone number, for example, can result in Google extracting the number and publishing it with the search results.

Knowledge Graph Optimization prepares Website content for what is effectively syndication of granular content.

But not all SEO experts or Website publishers approve of this appropriation of content. Many are product manufacturers, like fund companies, and they’re insisting that they should be able to be both the authoritative source of information and a search destination. For two perspectives, see Knowledge Graph 2.0: Now Featuring Your Knowledge and Knowledge Graph: Does it Make Sense to Optimize for the Google Scraper?

We live in interesting times.

So, where does this leave the asset management Website and Web strategy?

Next: Converting Searches For Fund Names

I remember how shocked my team and I were back in the day when we saw the first analytics that revealed that our site’s Daily NAV pages were the most popular pages. That made sense then for two reasons: 1)This predated the fund data aggregators and 2)advisors habitually used multiple funds from the same fund family—a late afternoon or evening visit to the fund sponsor’s Daily Prices page was all they needed.

The bleak future of sites that relied on single-page visits to pages whose data could be found elsewhere didn’t dawn on us until later.

Let’s turn now to your Web analytics. How much of your traffic goes to your product pages? Today, you may be missing out on ticker symbol searches, but my guess is that you’re still getting the traffic from people who are searching for your products by their names. This includes a long tail of searchers using a creative mix of how they spell, remember or type fund names. 

Such keyword searches are increasingly giving way to semantic searches, in which Google considers user search history as well as other contextual signals. It’s just a matter of time before Google looks at those incomplete, hastily entered fund names, automatically does the translation and understands that the searcher is looking for a fund. The fund data graph will be what's displayed as the top search result for all those searches, too.

The goal is to provide information fast, remember, and displaying the graph with the table of basic return, expense and asset size data is faster/more useful than just offering links to an asset manager fund page or, God forbid, PDF of a fact sheet. The implication for your site: More traffic (opportunity) lost.

This is your risk today. I make the assumption that traffic to your domain is something you want to protect, if not build, for a multitude of reasons that start with brand awareness and lead right up to lead scoring and predictive analytics initiatives.

A Few Recommendations

Here’s what the proactive asset management digital marketing team should be doing, at a minimum: 

  • Use the data available from Webmaster Tools and your Web analytics to get a handle on what’s what. Make sure you understand the sources of traffic to your fund pages and their value to you. How many anonymous visitors convert to newsletter subscribers or registered advisor site users, for example? How much of the traffic that Google sends to Google Finance, Morningstar, Yahoo Finance and MSN Money finds its way back to your site—how much as a result of the editorial versus advertising? 

Track all changes in your volume of search traffic and sources over time.

  • Confront the obvious: Why would a fund searcher be better off coming to your site as opposed to another site?

If you’ve researched a car in the last few years, you know that there are some automobile manufacturers that deliver superior, differentiated experiences on their Websites. Car buyers who rely exclusively on an Edmunds.com or other car review site are missing something if they don’t check out the configuration capabilities and other bells and whistles offered by the manufacturers.

What information can you uniquely offer and attractively/interactively present for product tire-kickers?

By the way, I had the “So, what’s so special about the fund information that appears on your site?” conversation with someone recently, and she answered, “We’re the only source of our capital gains distributions.” Well, OK, that’s a start. Those pages command a lot of eyeballs at this time of year. And yet, very few firms use the margins of those pages to cross-market or otherwise communicate.

There’s no stopping Google so control what you can control—give the site visitors you attract better information and a better experience, and that includes when on a mobile device. 

  • If you think your site offers worthwhile, appealing features and data that deserve the attention of fund data searchers, promote it. Don’t sit back and expect site visitors to find it. 

Make sure your wholesalers are versed on the depth of the fund data available on the site. Promote it on the home page, throughout the site and consider targeted pay-per-click ads. As of now, you can still buy your way to the top of the ticker symbol search. 

As Google gets more grabby to protect its own value proposition, you need to be more aggressive, too.  

  • Finally, if you can’t fight them and win, join them. Google’s evolution of the Knowledge Graph (whose answers are extracted from only the first page of search results) gives you just one more reason to commit to publishing authoritative mobile-friendly content that’s optimized for search.   

Your thoughts?