

Asset Manager Content Sharing Takes Off—Don’t Be Left Behind
/ TweetThere was a time not too long ago—seven months ago-ish—when the sharing of content published on mutual fund and exchange-traded fund (ETF) Websites was at low levels across the board.
That’s changing.
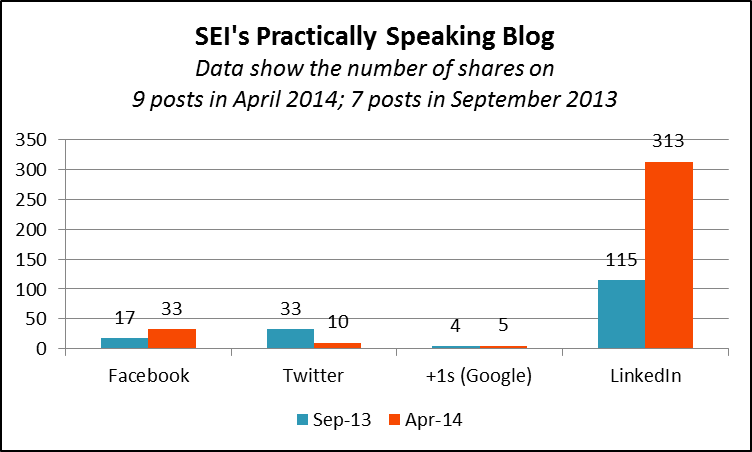
A comparison between the September 2013 sharing of content on the sites I blogged about in October with sharing in April 2014 shows that some fund companies are beginning to see significant sharing to social networks. Primarily to LinkedIn but not exclusively. The gains are stunning for BlackRock. Other firms are participating too, as you'll see below.

Why Isn’t Your Content Being Shared?
As for those of you whose content isn’t attracting the support you would hope for, it’s time to delve into why.
When nothing much is happening for your peers either, it’s easy to shrug your shoulders—i.e., uh, maybe nobody shares investment content. But now that others are starting to experience more of a social lift, what's keeping your content from participating? Let’s answer the question with a few questions:
- Are you making it possible to share? If you’re still publishing your commentary via Adobe Acrobat files, none of this applies to you. PDFs don’t get shared on social networks. Even if you and your content team are knocking yourselves out with the narrative and the graphics, you can’t be a contender and that’s unfortunate. This is particularly true of smaller firms—firms whose limited marketing resources could most benefit from a little help from others.
If at all possible with the Compliance direction at your firm and your Web publishing capability (or whatever it is that prompted you to default to PDFs in the first place), I’d find a way to add some HTML commentary to your site, along with social sharing icons.
- How visible is your content? Waiting for others to find your content and pass it around is one way to go. The more effective way is to use your firm's own social accounts to call attention.
Investment content sharing happens on four networks: LinkedIn, Twitter, Facebook and Google+. The data suggest that the most significant thing you can do to increase the visibility of the content you publish is to post it as a company update to LinkedIn. If you’re not doing that yet, I’d make it a priority.
 A company presence on LinkedIn, hopefully buoyed by some support of your loyalist followers and even employees (where possible), should make a difference.
What we don’t know is the extent to which firms are paying for broader exposure through LinkedIn sponsored updates or advertising. That is the X factor. However, to my knowledge, there is no way to buy shares. Followers yes, but shares still need to be earned.
As shown on the graphs, LinkedIn casts the longest shadow here. There’s no site I looked at where tweets generated the most shares in April. But I want to put a word in for Twitter. Twitter is an effective means of calling attention to the availability and relevance of your content to the world at large, including topical news-hungry financial advisors, the media and other influential accounts. As impressive as the LinkedIn numbers are, don’t underestimate the power and reach of a few tweets.
Facebook may be fading as a network where investment firm content gets shared to. In the set of data I looked at, Facebook shares were most important to Franklin Templeton's Beyond Bulls & Bears blog in the fall. That contribution seems to have dimmed since the start of the year (see below).
Google+ is a no-show in this data. With the singular exception of the Vanguard experience, little content produced by investment firms has been shared there over the last seven months. Now, after the surprise departure last week of Google+'s business leader and reported staff reorganizations, the prospects for the platform as a whole is in question.
- Is your content visually appealing? A sea of gray text is going to get you and your content nowhere. You need images—lists, charts, even stock photos. And how about some subheads or pull-quotes to give your content a fighting chance?
- What’s the quality of your content? The availability, visibility and appeal of the look of the content is where most firms need to focus, I suspect. But in my analysis, I did come across a few firms that were posting to LinkedIn and not seeing much sharing.
Creativity in this space and elsewhere has raised the content bar. You can’t expect to attract many eyeballs, let alone stimulate sharing by publishing one post after another all with the headline “Market Update.”
As difficult as this conversation may be with your content creators, you need to have it, to make the most of your collective effort. Take the data with you to the meeting.
Some Sharing Successes
My analysis in October looked at the sharing of investment commentary-type content published, mostly on blogs, by 10 firms (AllianceBernstein, BlackRock, First Trust, Franklin Templeton, Guggenheim, MFS, OppenheimerFunds, PIMCO, Vanguard and WisdomTree). I used the SharedCount multi-URL dashboard to look at how many times a URL was shared on social networks. This data should be reliable as it’s based on direct queries to the networks.
 Included were URLs to all posts published by the firms in September, a total of 111 posts. The mix included 22 updates from BlackRock on the high end and 4 from MFS on the low end.
Please see the post for the full report. To give you an idea, content published on all 10 domains resulted in 1,500 shares on LinkedIn.
After recently noticing much more sharing on some sites, I decided to return to SharedCount for an update.
Sure enough, sharing is up across the board.
If I were a digital marketer at a firm not benefitting from sharing, I might be tempted to discount the BlackRock results. There can be only one BlackRock and you may never be able to match BlackRock’s blog post production (21 posts in one month), helping drive 7,400-plus shares.
But the pattern across multiple firms suggests that sharing of your content should be on the rise, too, regardless of the size of your brand’s footprint or even how often you publish. One of the blogs I looked at earlier was MFS’ On The Lookout, which published five posts in September. There were just two postings in April and yet one post produced 77 LinkedIn shares versus 5 total LinkedIn shares of all five September posts.
What's more, the sharing has been building. To confirm this, I analyzed the URLs of all BlackRock (the most prolific blog in this set, consistently producing 20-plus posts each month) and Guggenheim (the least prolific, producing a steady four Macro View posts a month) content published from September through April. Who's to say that April represents the top?
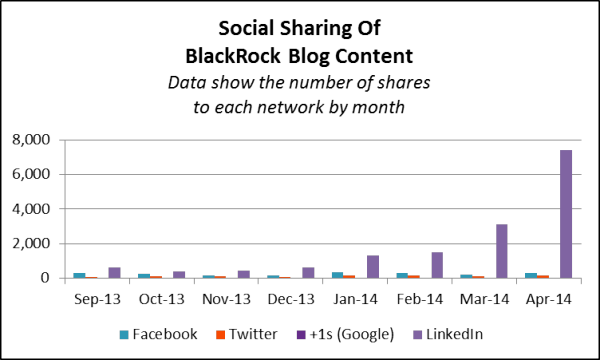

The additional graphs that follow are included not for the absolute numbers involved but to show the change.


What are your thoughts?

